
Hello!
When I made my First Quarter Reading Stats in April, I found the statistics incredibly satisfying but being able to do a direct comparison three months later? It might make me boring to find that exciting but I really do.
This data is the entire reason I use Storygraph instead of Goodreads and I have no regrets.
So at the end of Q1, I’d read 17 books which put me on a trajectory to hit my reading goal in August – by Q2, I’ve read 44 books, hitting my reading goal for the year over six months early. In the last three months I’ve started using my Kindle again which I think has helped me read even more than I did in Q1 (I’m not sure how I’m doing it to be honest), but I have taken my total of new buys up to 51 which… isn’t great.
Again, I didn’t get screenshots before I finished my first two books of July so take the statistics with a pinch of salt.
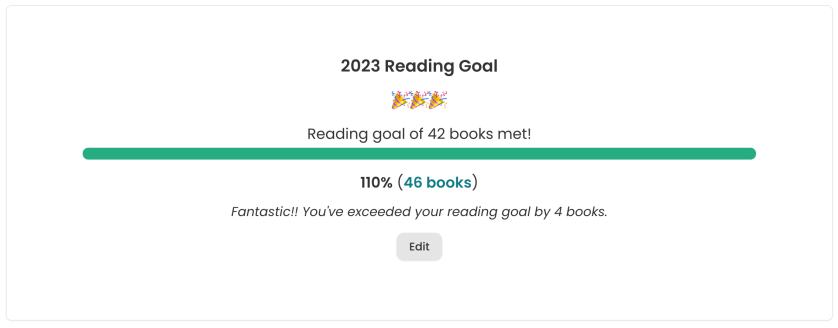
I mean, sharing this is completely irrelevant since I’m not updating my goal, but even Storygraph has given me little party poppers and it makes me happy.
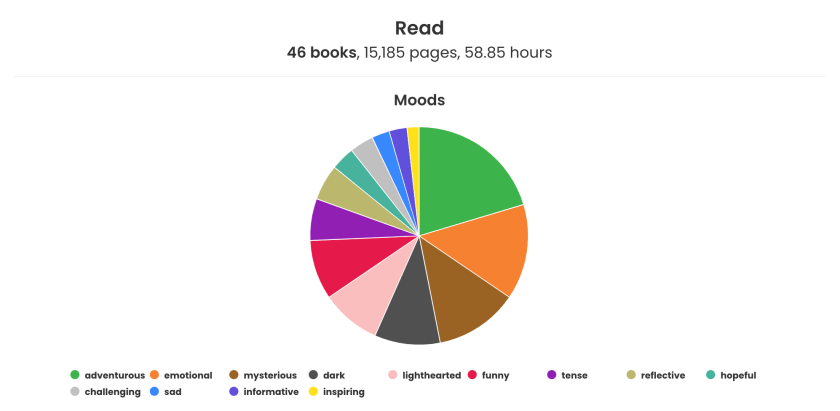
I’ve read four new moods since my Q1 check in – my top three moods in March were adventurous, mysterious and lighthearted. Adventurous still seems to be my most popular mood but not as bigger proportion, followed by emotional and mysterious – emotional has knocked mysterious down to number 3! Though looking through the books that are classified as mysterious, I absolutely wouldn’t use that mood at all to describe them, so we’re looping back to that pinch of salt thing.

This one made sense to do a direct comparison – I’ve read less long books and way more short books but I think roughly 75% ‘average’ length books is pretty reasonable! I’d still say my ideal is between 300-400 but trying to spend more time with audiobooks and ebooks means that the length of the book feels way less relevant.
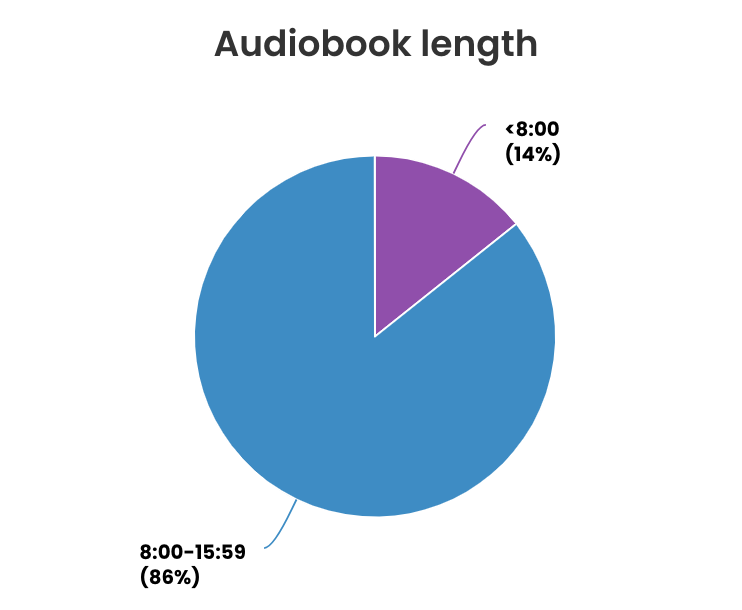
I didn’t include Audiobooks in the Q1 data as I think they were all between 8-16 hours so it was a lovely blue circle, but I’ve picked some shorter titles in an effort to try and get through them more quickly so now there’s a little purple section too!
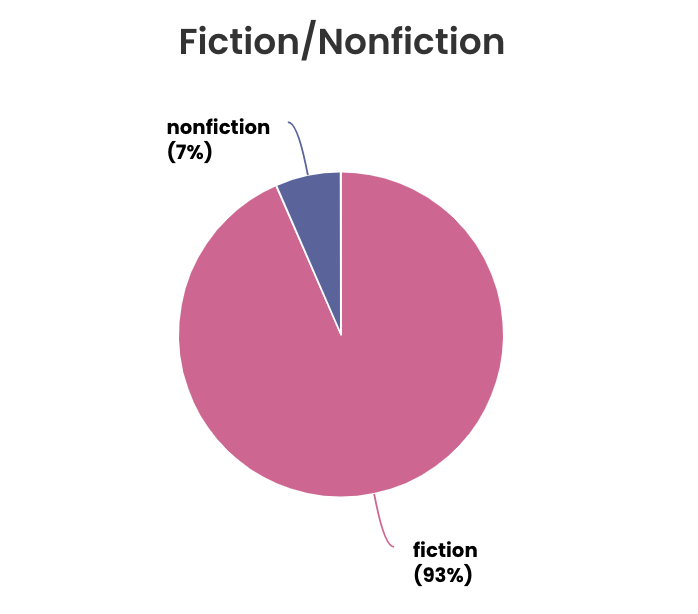
Possibly the biggest update since Q1 is that my pink circle of 100% fiction has a chunk of non-fiction now! I’ve read three non-fiction books and two of them were 5 star reads (the other was a Horrible Histories book so I still had a very nice time). I’d like to read more non-fiction but as I keep saying, I want to prioritise my backlog TBR first.
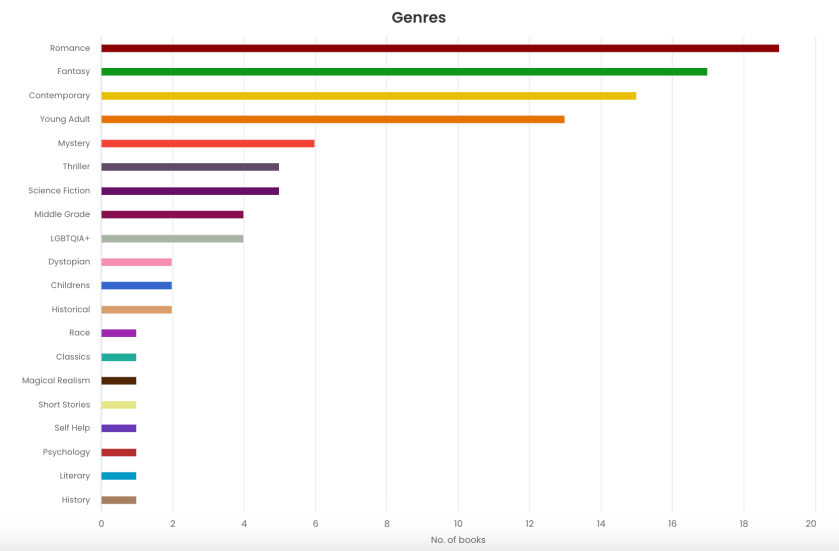
I’ve actually doubled the amount of genres I’ve read this year – in Q1 my top three were YA (which I’d still argue is not a genre), Romance and Fantasy and I’ve now surpassed YA making my new top three Romance, Fantasy and Contemporary and honestly I think that’s a perfect representation of my favourite genres. Glancing down the list, I have no idea why Thriller is so high but I imagine the books classified as ‘thrillers’ are books that I wouldn’t call thrillers at all. I’m disappointed that LGBTQIA+ is so low but the thing with using a TBR jar to choose what I read is that I don’t have any way of telling what genre is on the slip of paper. I think we can still consider 20 genres quite broad reading though!

I’m actually really proud of how I’m diversifying my reading – whilst print books are the ones I’m tracking on my tbr, I’m using other formats to help with that; I’ve started using my Audible credits on books that I own physically so that I can listen to it without juggling all my paperbacks. I’ve been finding some of my tbr on Kindle Unlimited and Prime Reading and although I’m still figuring out how to juggle Kindle reading and paperback reading, using different methods makes me feel more productive (even if it isn’t actually making me more productive).

I don’t think I included this data in Q1 either, but I’ve really expanded the authors I’m reading and which authors I’m repeating too. Though so far, all of these authors are here because I read a series – Anthony Horowitz wrote Alex Rider which I finished in January, Becca Fitzpatrick wrote the hush, hush series which I regretted reading in May and Naomi Novik wrote the Scholomance series which I’ve read over the course of the year. Some of these authors I have other books from – I have another Anthony Horowitz series, I am waiting for the day that Helen Hoang announces her next book and I have a couple of other Colleen Hoover books in my library. I do like reading a series but I get panicked that I’ll forget details so I make myself read the entire series in one go, which when a series like Alex Rider has 13 books is a lot of commitment. The longest series I own is probably Skulduggery Pleasant so there’ll be a lot more Derek Landy in this graph when I get to that!

This graph is my favourite part of Storygraph, hands down. When I read 7 books in January I thought I was off to a good start but I probably wouldn’t match it again, and I didn’t for the next three months.
Then I went on my honeymoon in May and read 8 books in two weeks. Then somehow, I managed to match that in June. Now I’m in that spiral where I’m not sure if I’m reading a lot because I’m enjoying both the stories and the statistics, or if I’m reading a lot for the sake of the statistics. I don’t think it’s the latter, but I do really like the statistics. A colour coded graph tickles my pickle.
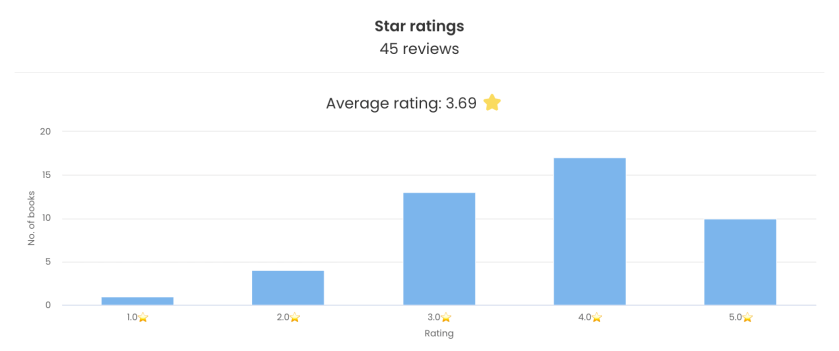
In Q1, I had only read 3+ star books and now I’ve used the full spectrum of ratings. I’m too stubborn and reluctantly optimistic to DNF books (unless I’m really bored) so I have finished every book I’ve started this year, but it’s nice to see that the data definitely skews towards me enjoying more books than I didn’t!
That’s it for Storygraph data, but there’s one more thing I want to compare from my personal spreadsheet:

This data helps me track how many books I have left on my physical tbr – with the number of total unread books I bought at the start of the year, adding the books I’ve bought, the books from my backlog that I’ve read and the total number of I’ve read I can calculate how many unread books I now have in my collection.
Since the beginning of April, I’ve bought 19 more books (I have a serious problem), I’ve read 13 more from the books I owned pre-2023 and 28 more books total since I took the Q1 screenshots. I’m not sure the maths entirely adds up cos theoretically my unread total should be my 2022 total + new buys – number I’ve read and I’m not sure those numbers work out, but that’s something I can work on for the 2024 spreadsheet!
Optimistically that means my tbr is lower than I thought but I’ll keep rolling with these numbers for the foreseeable!
And there we are halfway through the year! I keep track of my data from previous years and before this year, my most successful reading year was 2021 with 45 books – I’ve read 46 and it’s only the first week of July. Whilst it would be so easy to say I’ve been out of work so I’m not restrained by that, to say I’m procrastinating the real things I need to get done for reading but even though those things are completely true, I can still be proud of myself for this accomplishment and for making time for something I’m really enjoying right now.
Thank you for reading,
Sophie xx

Leave a comment